Plotting Regions with Matplotlib#
Plotting Pixel Regions#
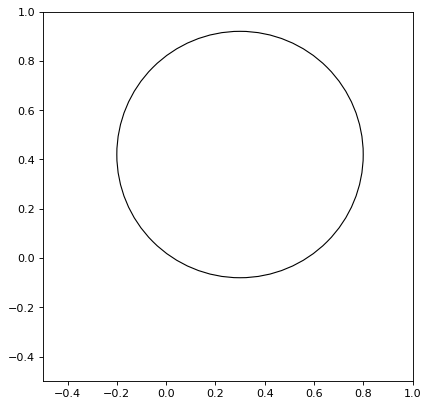
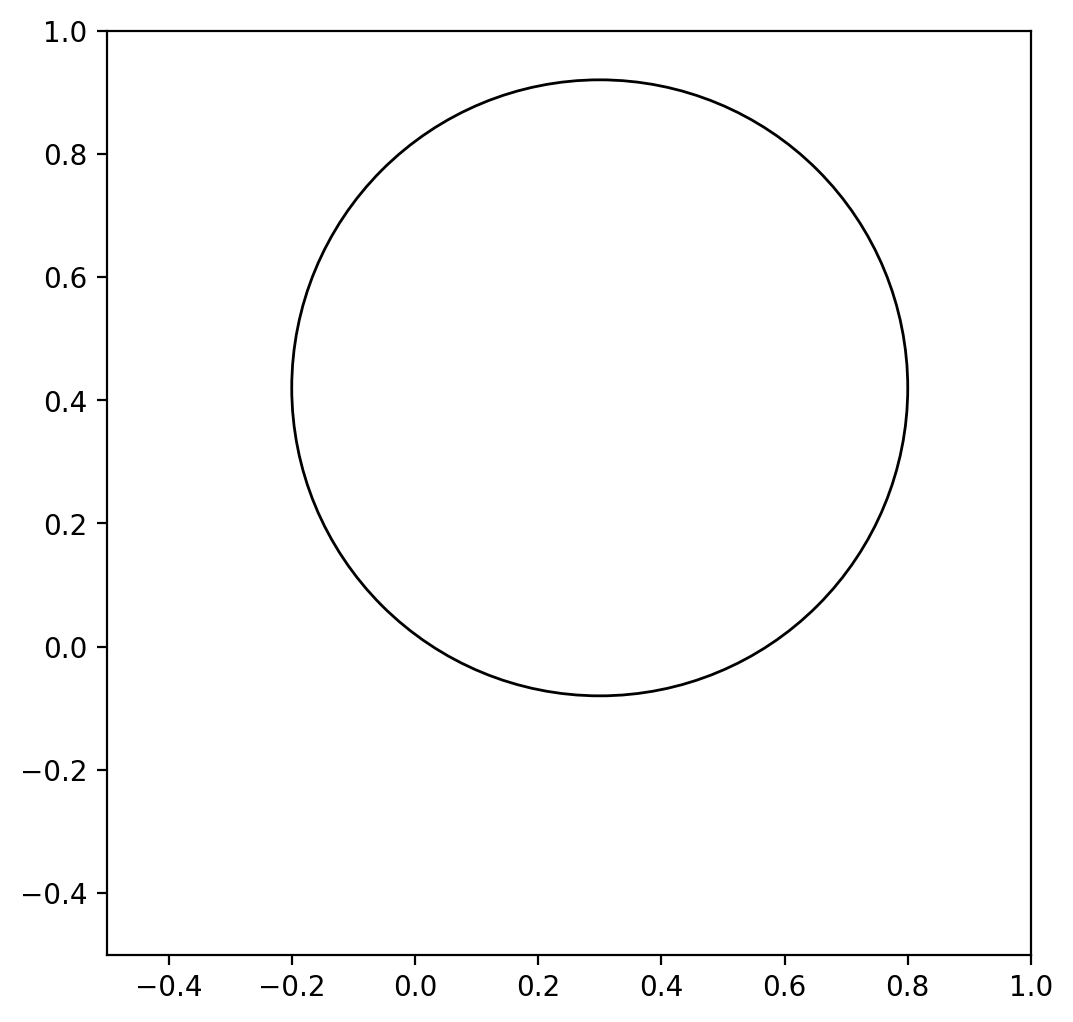
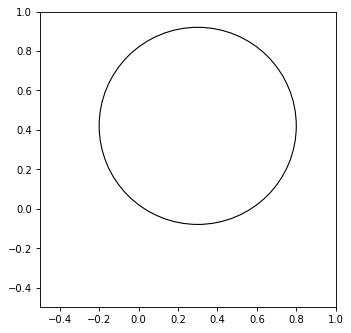
Some PixelRegion objects have an as_artist()
method that returns an equivalent matplotlib.patches object.
For example regions.CirclePixelRegion.as_artist() returns a
matplotlib.patches.Circle object.
To draw a matplotlib patch object, add it to an matplotlib.axes.Axes
object.
import matplotlib.pyplot as plt
from regions import CirclePixelRegion, PixCoord

region = CirclePixelRegion(PixCoord(x=0.3, y=0.42), radius=0.5)
artist = region.as_artist()

fig, ax = plt.subplots()
ax.set_aspect('equal')
ax.add_artist(artist)
ax.set_xlim([-0.5, 1])
ax.set_ylim([-0.5, 1])
(Source code, png, hires.png, pdf, svg)
The default keyword arguments for the matplotlib artist depend on the
value of the default_style keyword in the RegionVisual
dictionary. This keyword is currently set (to a value of ‘ds9’) only
when reading from DS9 region files. If this keyword is not set or set
to ‘mpl’ or None, then the matplotlib defaults will be used, with the
exception that fill is turned off for Patch and
Line2D artists.
The regions.PixelRegion.plot() method is a convenience method that
combines these two steps (creating a matplotlib patch artist and adding
it to an axis). If no axis is passed then it calls plt.gca().
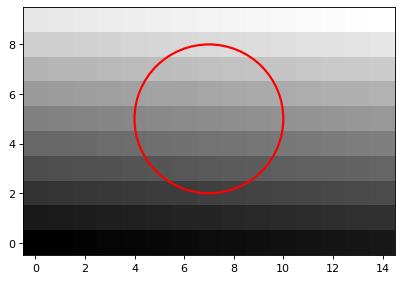
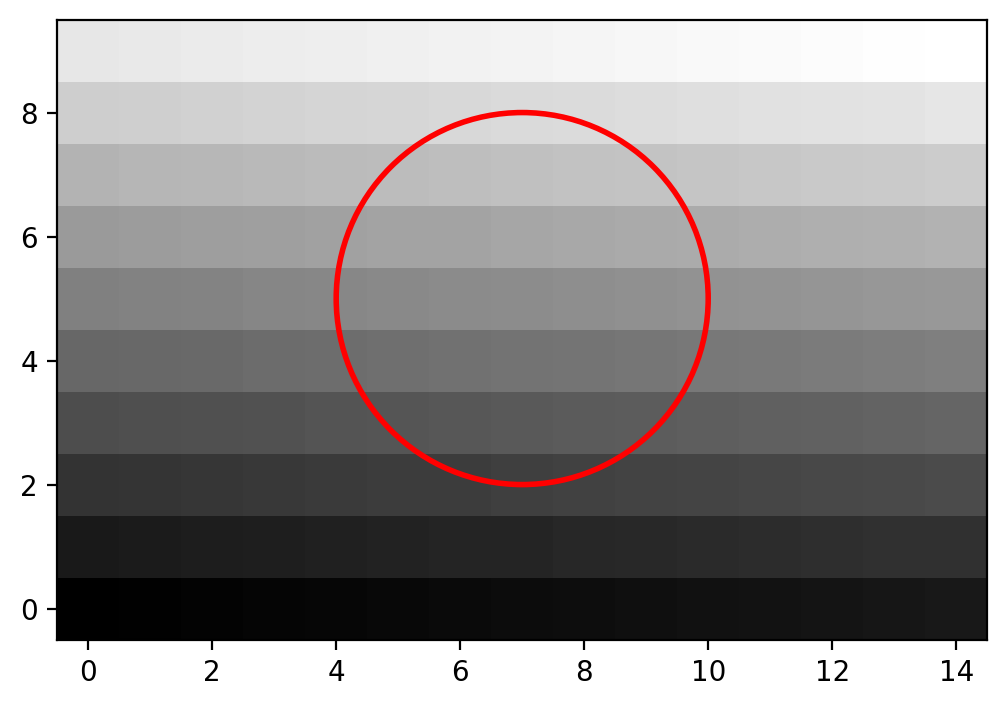
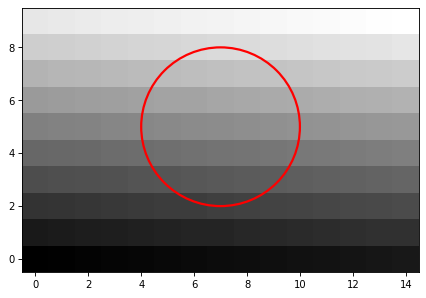
You can shift the origin of the region while plotting by supplying the
origin pixel coordinates to either plot()
or as_artist(). The
plot() method also takes any keyword argument
that the Patch object accepts for those regions
represented as patches, or arguments Line2D accepts
for point regions. For example:
import matplotlib.pyplot as plt
import numpy as np
from regions import CirclePixelRegion, PixCoord

fig, ax = plt.subplots()
region = CirclePixelRegion(center=PixCoord(x=7, y=5), radius=3)

data = np.arange(10 * 15).reshape((10, 15))
ax.imshow(data, cmap='gray', origin='lower')
region.plot(ax=ax, color='red', lw=2.0)
(Source code, png, hires.png, pdf, svg)
The documentation for RectanglePixelRegion and
EllipsePixelRegion also shows plotting examples.
Plotting Sky Regions#
Note that SkyRegion objects do not have an as_artist() or
plot() method. To plot a SkyRegion object, you will need
to convert it to a pixel region (using a WCS object):
>>> from astropy.coordinates import Angle, SkyCoord
>>> from regions import CircleSkyRegion
>>> sky_center = SkyCoord(42, 43, unit='deg')
>>> sky_radius = Angle(25, 'deg')
>>> sky_region = CircleSkyRegion(sky_center, sky_radius)
>>> pixel_region = sky_region.to_pixel(wcs)
>>> pixel_region.plot()
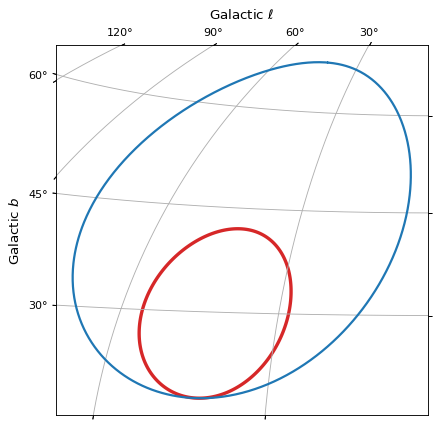
Plotting Spherical Sky Regions#
Similarly, SphericalSkyRegion objects do not
have an as_artist() or plot() method. To plot a
SphericalSkyRegion object, you will need to convert it to
a pixel region (using a WCS object). Boundary distortions can also be
included in this conversion (by setting the boundary_distortions
keyword), to capture the effects of the WCS projection from spherical to
a planar geometry. See the second example in Examples.
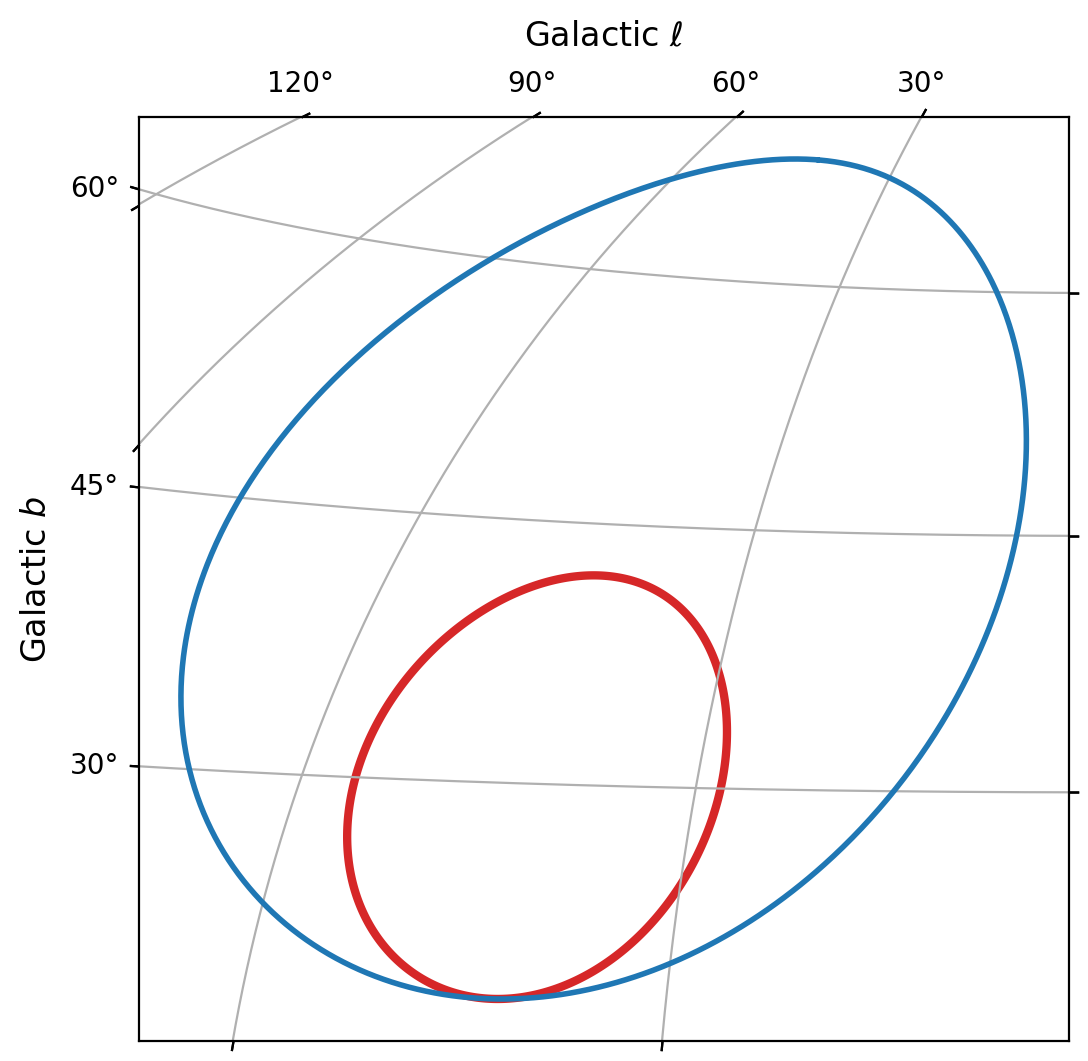
It is also possible to use the coordinates of a discretized
SphericalSkyRegion to show the region’s boundary in a figure.
import matplotlib.pyplot as plt
from astropy.coordinates import Angle, SkyCoord
from astropy.wcs import WCS
from regions import CircleSphericalSkyRegion

wcs = WCS(naxis=2)
wcs.wcs.crpix = (180, 90)
wcs.wcs.cdelt = (-1, 1)
wcs.wcs.crval = (0, 0)
wcs.wcs.ctype = ('GLON-AIT', 'GLAT-AIT')

sph_sky_center = SkyCoord(42, 30, unit='deg', frame='galactic')
sph_sky_radius = Angle(12, 'deg')
sph_sky_region = CircleSphericalSkyRegion(sph_sky_center, sph_sky_radius)

fig = plt.figure()
ax = fig.add_subplot(projection=wcs)
ax.grid(True)
ax.set_xlabel(r'Galactic $\ell$')
ax.set_ylabel(r'Galactic $b$')

sph_sky_region.to_pixel(
    wcs=wcs,
    boundary_distortions=True,
    n_vertices=1000,
).plot(ax=ax, color='tab:red', lw=3)

sph_sky_center2 = SkyCoord(42, 43, unit='deg', frame='galactic')
sph_sky_radius2 = Angle(25, 'deg')
sph_sky_region2 = CircleSphericalSkyRegion(sph_sky_center2, sph_sky_radius2)
poly_sph_sky2 = sph_sky_region2.discretize_boundary(n_vertices=1000)
ax.plot(
    poly_sph_sky2.vertices.l,
    poly_sph_sky2.vertices.b,
    lw=2, color='tab:blue',
    transform=ax.get_transform('galactic'),
)
(Source code, png, hires.png, pdf, svg)