Examples#
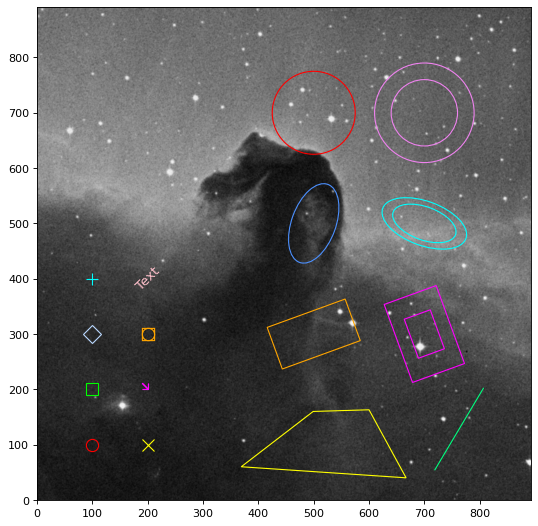
Read and plot DS9 region files#
The following example shows how to read a DS9 region file and plot the regions on an image using Matplotlib.
import numpy as np
from astropy.io import fits
from astropy.utils.data import get_pkg_data_filename
from matplotlib import pyplot as plt
from regions import Regions

image_file = get_pkg_data_filename('tutorials/FITS-images/HorseHead.fits')
data = fits.getdata(image_file, ext=0, memmap=False)
data = np.rot90(data, k=-1)

fig, ax = plt.subplots(figsize=(8, 8))
ax.imshow(data, cmap='gray', origin='lower')

region_file = get_pkg_data_filename('data/plot_image.reg',
                                    package='regions.io.ds9.tests')
regions = Regions.read(region_file, format='ds9')
for i, region in enumerate(regions):
    region.plot(ax=ax)
(Source code, png, hires.png, pdf, svg)

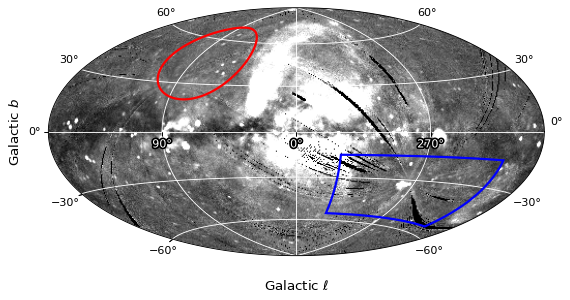
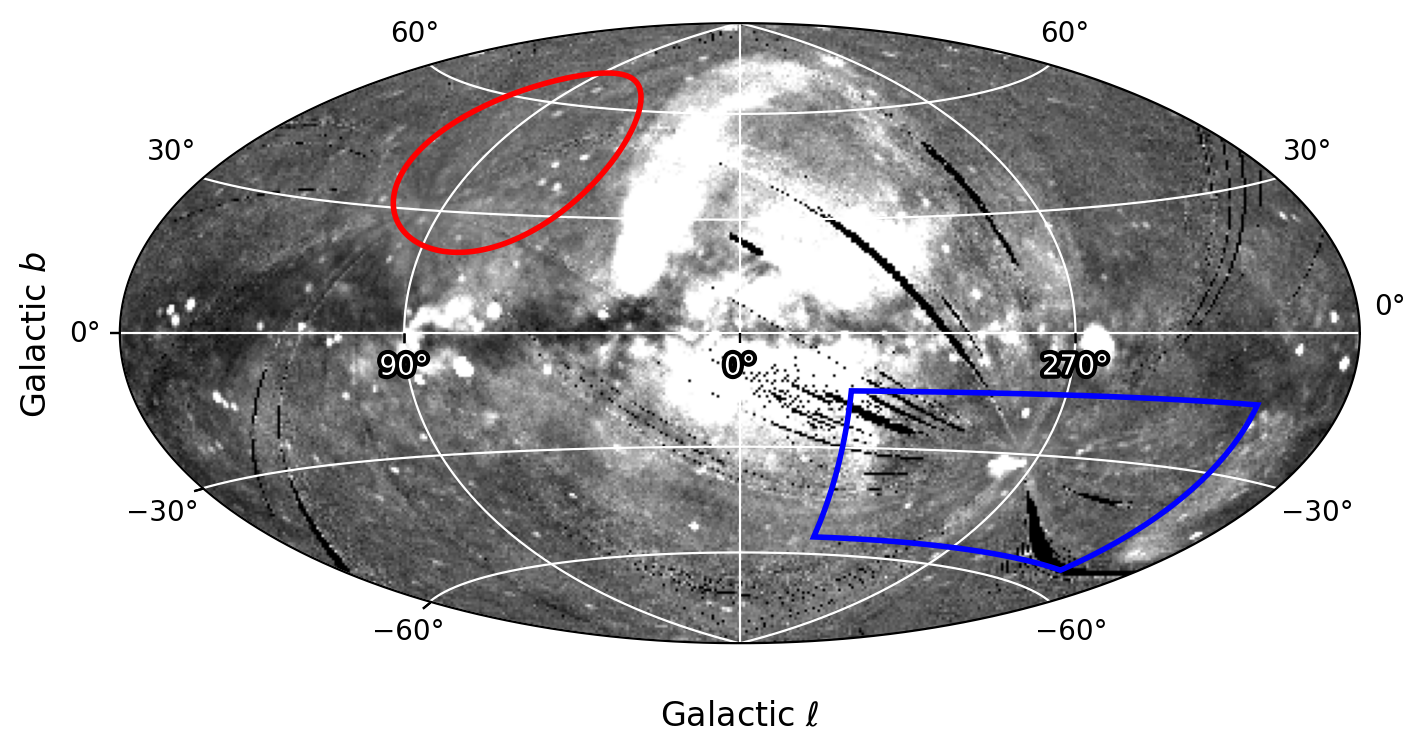
Plotting spherical regions on a full sky image#
The next example demonstrates how to plot spherical regions (e.g., a circle and a longitude/latitude “range”) on a full sky image (seen in this Astropy visualization demo).
import astropy.units as u
import matplotlib.pyplot as plt
from astropy.coordinates import SkyCoord
from astropy.io import fits
from astropy.utils.data import get_pkg_data_filename
from astropy.visualization.wcsaxes.frame import EllipticalFrame
from astropy.wcs import WCS
from matplotlib import patheffects
from regions import CircleSphericalSkyRegion, RangeSphericalSkyRegion

image_file = get_pkg_data_filename('allsky/allsky_rosat.fits')
image_data = fits.getdata(image_file, ext=0, memmap=False)
image_hdr = fits.getheader(image_file)
wcs = WCS(image_hdr)

fig = plt.figure(figsize=(8, 8))
ax = fig.add_subplot(projection=wcs, frame_class=EllipticalFrame)

path_effects = [patheffects.withStroke(linewidth=3, foreground='black')]
ax.coords.grid(color='white')
ax.coords['glon'].set_ticklabel(color='white', path_effects=path_effects)
ax.set_axisbelow(True)
ax.set_xlabel(r'Galactic $\ell$', labelpad=10)
ax.set_ylabel(r'Galactic $b$')
im = ax.imshow(image_data, vmin=0., vmax=300., cmap='gray',
               origin='lower')

# Clip the image to the frame
im.set_clip_path(ax.coords.frame.patch)

# Image is in galactic coordinates
circ = CircleSphericalSkyRegion(
    SkyCoord(80, 45, unit=u.deg, frame='galactic'),
    25 * u.deg)
circ.to_pixel(
    wcs=wcs,
    boundary_distortions=True,
    n_vertices=1000,
).plot(ax=ax, edgecolor='red',
       facecolor='none', lw=2)

lon_lat_range = RangeSphericalSkyRegion(
    frame='galactic',
    longitude_range=[210, 330] * u.deg,
    latitude_range=[-55, -15] * u.deg,
)
lon_lat_range.to_pixel(
    wcs=wcs,
    boundary_distortions=True,
    n_vertices=250,
).plot(ax=ax, edgecolor='blue',
       facecolor='none', lw=2)
(Source code, png, hires.png, pdf, svg)